Where Infrastructure Investment Is Turning Into Bidding Activity
Shanice Lodge
Nearly five years after the Infrastructure Investment and Jobs Act was signed into law, federal infrastructure dollars are now moving from announcements toward real projects.
The latest U.S. Department of Transportation IIJA Funding Status, covering data through August 31, 2026, reports $424.2 billion in obligations and $262.4 billion in outlays. That represents 77.71% of available funding obligated and 48.08% outlayed. The department explains that obligations occur once DOT and grant recipients enter binding agreements, while outlays represent funds actually paid for eligible expenses.
Those two percentages show that funding does not automatically mean bid opportunities. The real opportunity comes when funding progresses far enough to produce projects that contractors can identify, qualify for, and pursue.
The high-level question now becomes: Where is that investment turning into work that you can bid on?
Where Is Infrastructure funding moving?
The Federal Highway Administration says the IIJA provides approximately $350 billion for federal highway programs over fiscal years 2022 through 2026, with most of that funding apportioned directly to states and additional funding distributed through competitive grant programs.
According to ARTBA’s Highway Dashboard, states had committed $300.5 billion in highway and bridge formula funds to approximately 129,600 projects through August 2026.
These figures show the scale of investment, but they don’t tell us which public opportunities are coming up, and where. For that, we need to look closer to the actual bidding market.
What Does the Bidding Market Look Like Right Now?
Hubexo’s Bid Ocean provides another perspective: what construction companies can actually pursue.
Total Active Public Construction Opportunities
Metric
Value
Total active opportunities
39,231
Source: Hubexo Bid Ocean proprietary data, October 2026. Project values reflect opportunities where a value is available.
This starts to answer a much more practical question:
How much public-sector work is actually in market?
A state with a high number of projects is not necessarily the state with the highest-dollar opportunities. A regional contractor looking for a steady pipeline of smaller public projects may interpret this market very differently from a large heavy-civil contractor looking for fewer, larger opportunities.
The picture gets even more relevant when we break activity down by trade. Bid Ocean currently shows:
Top Five Trade Groups
Rank
Work Type Group
Opportunities
1
Building Trades
30,708
2
Specialty Trades
20,986
3
Purchase, Rental or Lease of Goods
14,315
4
Other Services
14,007
5
Utility Construction & Rehab
13,804
For contractors, the advantage comes from finding relevant work entering their markets, within their trades, early enough to have a realistic opportunity to pursue it.Find relevant opportunities now.
How to find public construction opportunities
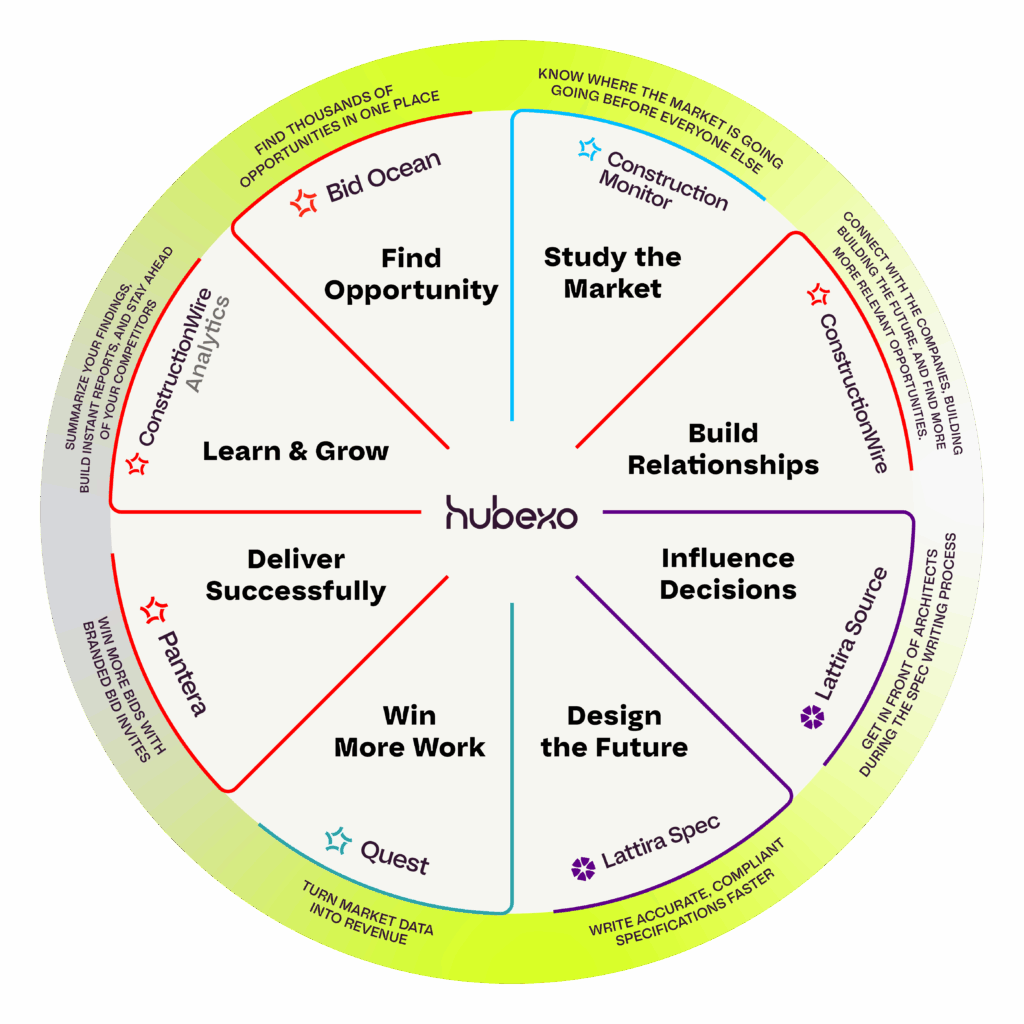
This is where the broader Hubexo construction ecosystem becomes useful.
Federal and state investment continues to fund public construction. Your job is to find the opportunity and win. Across the Hubexo ecosystem, each solution supports a different stage of that process:
Bid Ocean: Find opportunities Quest: Bid on opportunities Pantera: Manage ITBs and prequalification
Bid Ocean helps contractors identify public opportunities relevant to their business instead of relying on disconnected searches across government sites. Users can filter opportunities by trade, geography, and project value.
For general contractors managing subcontractor relationships, Panteraextends the workflow through ITBs and prequalification.
Together, they connect more of the journey from market discovery to pursuit within the Hubexo ecosystem.
Instead of treating project discovery, bidding, and subcontractor outreach as disconnected activities, the three products represent different points in the same construction opportunity lifecycle.